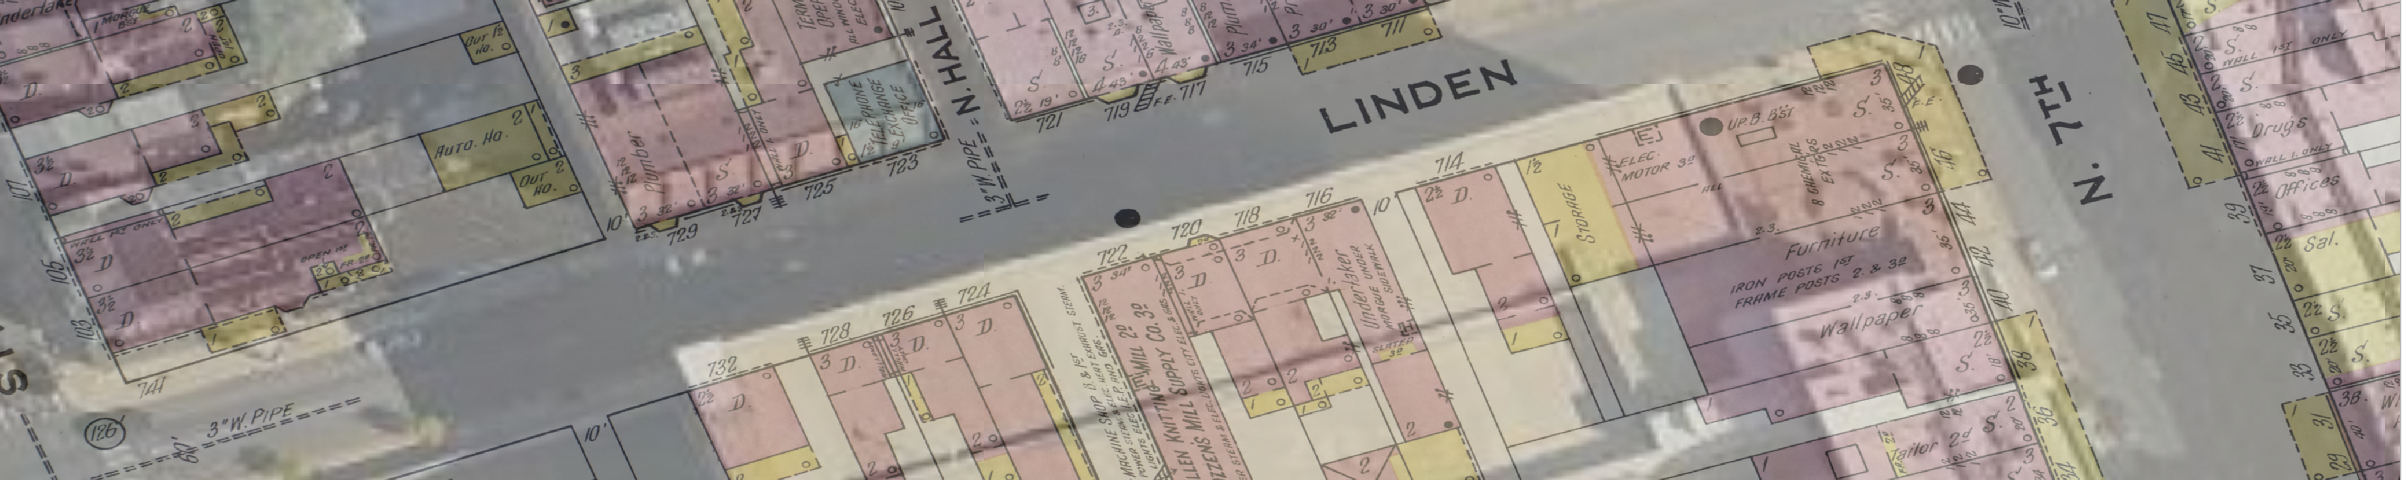
A translucent 1911 Sanborn Fire Insurance map overlaying the area near the PPL Center in Allentown, PA. Sanborn map courtesy Library of Congress.
Georeferencing Historical Maps
In this activity, we will take one or more Sanborn Fire Insurance maps from 1911, and bring them into QGIS using the Georeferencer tool. Sanborn maps are especially good for this activity for a few reasons. First, they nearly always clearly mark road centerlines. These are resistant to change through time, especially in cities employing a grid, like Allentown. Second, these maps are of exceptionally high quality. They are highly accurate (for their time) and needed to be, as their main purpose was to document buildings, materials, sources of heating and light, and other features necessary to set premiums and evaluate claims in the case of a building fire.
The walkthrough for tonight’s activity is available here:
https://docs.google.com/document/d/1l5uPUEXqo9TjwZEMX9-5did7-cIFS503ThC9i1OhkyY/edit?usp=sharing
I have pre-selected two Sanborn maps and clipped the municipal boundary of Allentown, and made them available here:
https://drive.google.com/drive/folders/1y3ZurRMfSsQANBw4GQri6WcDxxymF-1a?usp=sharing
Why Georeference Historical Maps?
The GIS epoch, the span of time when maps could be ‘born digital’ arguably dates to the early- to mid-1990s. While some GIS existed prior to this date, the software was rudimentary and could only effectively run on large mainframe computers. Transfer of digital/digitized maps between computers was nearly non-existant. But, generously, the ‘born-digital’ map date might even be extended as far back as the late 1970s or early 1980s.
But think about the whole span of analog mapping (cartography) that existed before this GIS epoch, and all the forms of non-digital mapping that exist alongside GIS and digital mapping, today. There is an immeasurable amount of valuable information contained in paper maps that should not be lost or ignored simply because of its non-digital media. When we have a need to merge historical maps with digital information, there is a process for georeferencing these maps. In simple terms, we digitize a paper map, typically by scanning it in whole or in part. Then, we match some number of points on a digitized map with those same points already incorporated into a GIS. Where enough of these points coincide, algorithms can ingest the entire digitized map and reference it to other geospatial map layers. This allows overlaying historical maps with contemporary GIS data.
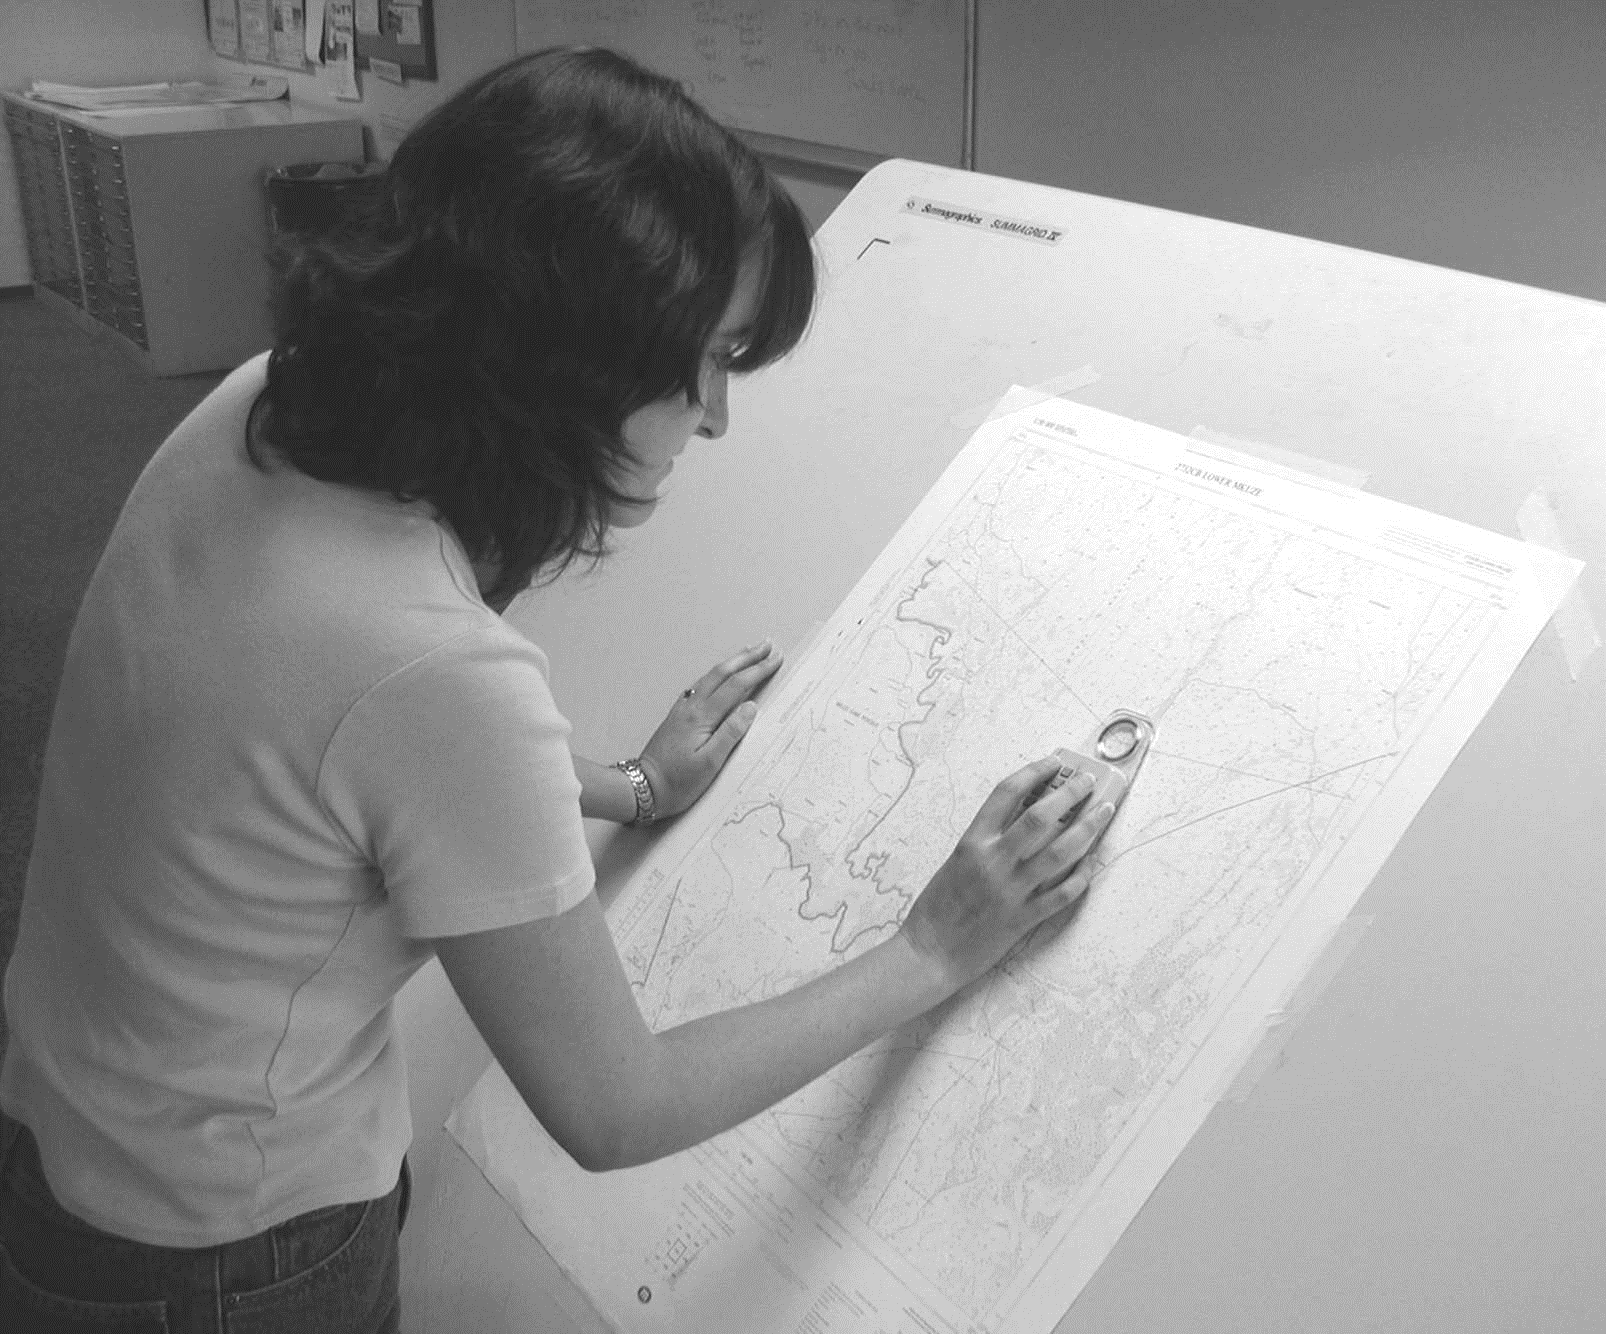
Georeferencing must begin with some process to digitize paper maps. Large format scanners are expensive and for that reason, uncommon. Large format digitizing tables utilizing a ‘puck’ to digitally capture points, like the one in the picture below, are even more specialized and less common (and nearly obsolete).
https://vector.geospatial.science/textbook
Once a map has been digitally scanned, software like QGIS can facilitate georeferencing. The past can be incorporated and visualized along with contemporary data. This can serve as a powerful search and retrieval mechanism, or as a means of analyzing geospatial phenomena over longer spans of time.
Here is a digital humanities project that makes use of U.S. Cenus data and Sanborn maps to visualize Harrisburg, PA at the turn of the century: https://digitalharrisburg.com/exhibits/harrisburg1900/.
Here is an incredible resource made available through the ESRI Living Atlas of scanned and georeferenced Home Owners’ Loan Corporation (HOLC) Neighborhood Redlining Grades. You can find use these maps here: https://www.arcgis.com/home/item.html?id=ef0f926eb1b146d082c38cc35b53c947. Made available in 2020, these redlining maps of 143 cities (and growing) have already contributed to a powerful body of research on health outcome disparity, food insecurity, and urban heat island correlation.