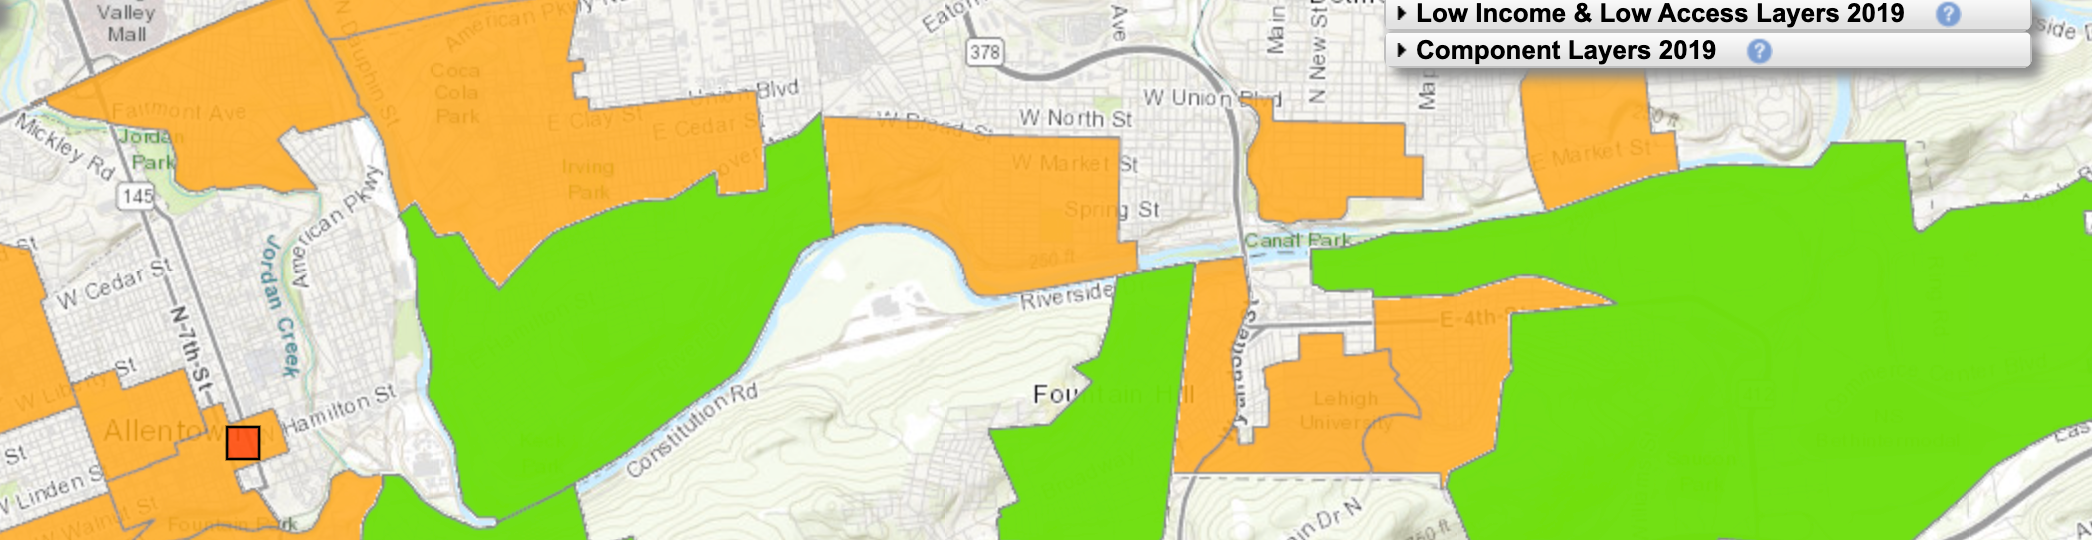
Selection of the Allentown, PA area from the USDA Economic Research Service’s Food Access Research Atlas (FARA), available here: https://www.ers.usda.gov/data-products/food-access-research-atlas/go-to-the-atlas/
Choropleth Maps – Part Two
We will continue to generate choropleth maps using American Community Survey data, specifically data found within table S2201: Food Stamps/Supplemental Nutrition Assistance Program (SNAP), for all 50 states. We will be working with 1 year data for all 50 states, available here: https://data.census.gov/table/ACSST1Y2022.S2201.
During last class, we spent a fair amount of time wading through the complicated and cumbersome CSV file containing many, many columns containing very specific distillations of ACS Food Security data based on race, ethnicity, age, and domestic arrangements (e.g., female householder, no spouse present, with children under 18 years of age). We explored the metadata files that accompany ACS data tables, and gleaned which codes (and combinations of codes) might help us select data germane to our mapping activity. THIS WAS REALLY CHALLENGING!
To hopefully make this task easier, I have organized the ACS S2201 table to group percentages columns together, and to select those columns that pertain most directly to households below poverty level receiving nutritional assistance or not receiving nutritional assistance. That Google Spreadsheet is available here:
For the remainder of this activity, we will work together to create two choropleth maps — one depicting the estimated percent of households below poverty level receiving supplemental nutritional assistance, and the other depicting the percent of households below poverty level NOT receiving nutritional assistance.
From here, we will use the QGIS layout manager to present these two choropleth maps side by side, with a legend box, and labeling each state by its estimated percent margin of error.
Once we have worked through this ACS activity together, creating a choropleth world map using world geographic boundaries and the U.N. HDI index for 2021 should be more manageable. Once the choropleth map is created, please use the QGIS layout manager to generate a PDF version of the entire world map, or some selection. This map should also contain a legend box and a title describing the contents of the map.
[BONUS] The Food Access Research Atlas (FARA)
Our culminating activity will focus on the steps necessary to build a GIS-based research project. We will draw upon prior activities to research food insecurity and nutritional redlining in the Lehigh Valley and beyond. One tool that will help us gain some background understanding of the issues influencing food access is the Food Access Research Atlas, a product of the U.S. Department of Agriculture Economic Research Service. The Food Access Research Atlas is available here:
https://www.ers.usda.gov/data-products/food-access-research-atlas/go-to-the-atlas/
This atlas offers census tract-level overlay analysis of what it describes as, “indicators of food access for subpopulations” based on 2019 data. There is a helpful interactive guide that carefully explains the rationale for the atlas, the sources of data used to build the atlas, and the kinds of assumptions that are appropriate to make from the geospatial data presented. The guide is available here: